


Air Particle Matter Pollution Assessment: Applying IoT and DLT Technologies to High Volume Air Samplers
Aerosols are fine solid particles (particulate matter, PM) or liquid droplets in gas (usually air), whose origin can be natural or anthropogenic. Air PM pollution exposure is linked to diverse human health problems and also to many environmental effects. People living in urban environments are potentially more exposed to polluted air.
The aerodynamic properties of particles determine how they are transported in air and how they can be removed from it, as well as how far they get into the air passages of the respiratory system [1] [2]. Particles with an aerodynamic diameter [3] equal or less than 10 µm (PM10) can be hazardous to human health, and those equal or less than 2.5 µm (PM2.5) can reach alveoli during respiration and then they may be absorbed into the bloodstream. WHO (World Health Organization) states that there is strong evidence to conclude that fine particles PM2.5 and smaller are the more hazardous in terms of mortality and cardiovascular and respiratory endpoints in panel studies [2].
To study air pollution, airborne PM in ambient air is collected using High Volume (HVAS) and Low Volume (LVAS) Air Samplers equipped with special filters. The main blocks of an air sampler are four: air inlet (usually an inertial classifier), special PM filter, air pump, and control unit.
The PM retained in the filters can be studied using several techniques, depending on the objectives of the assessment (chemical, physical, and isotopic composition) [4] [5] [6]. Systematic periodic air sampling is needed to have a confident air quality assessment [7][8]. Usually, the mass concentration of particles (MC in μg/m3) and the standard mass concentration (SMC in μg/m3 std) are used to assess air quality. To accurately determine MC, it is important to measure instantaneous airflow and to calculate the total volume of air sampled in each sampling experiment. For SMC determination, real-time temperature, and pressure values at the sampling site must be measured to calculate normalized airflow related to EPA (Environmental Protection Agency) reference conditions [9][10].
Despite most of the modern air samplers have an electronic control unit, some models do not have any kind of digital flow recording or data transmission capabilities, nor environmental conditions measurement. In this situation, users usually must trust in the stability of airflow during the whole air sampling period (24 hours) when calculating MC.
In this article, we present an overview of the work done building a solution to enable access to the environment and flow data from existing HVAS with no digital data acquisition or transmission capabilities. The solution involves IoT, Cloud, and DLT (Distributed Ledger Technology) that are some of the technologies that are enabling and driving Digital Transformation. The main components are an electronic device called RDMA and a software application (called Enviro-AirSampling - ENVAS). This solution was implemented and is being used for air quality studies at the Laboratorios de Tecnogestion of the Ministry of Industry, Energy, and Mines (MIEM) of Uruguay. It brings valuable information to scientists for interpretation or air sampling results and a more accurate determination of MC and SMC. The RDMA was designed ab-initio to be an easy add-on to the existing Tisch Environmental HVAS owned by MIEM.
Developed IoT Device: RDMA
The RDMA measures and calculates volumetric flow rate, normalized volumetric flow rate, sampled air volume, normalized sampled air volume, external air temperature (T), dew point, relative humidity (H), ambient pressure (P), the average of T, H, P during each air sampling period and start and stop time of each sampling period. The measurements, internal (device) state information, and location coordinates are sent by the RDMA device to a custom implemented application called ENVAS running on the Cloud (Fig. 1). Communication between device and the Cloud is done using TCP/IP and TLS, with MQTT protocol used to transport data in JSON format.
The main components of the RDMA are an IP65 rated enclosure (containing the main electronics), an UV coated 3D printed external sensor shielding (housing the environmental sensors), an air pump on/off sensor, airflow signal input, and a power input cord. The microprocessor selected for the RDMA was the Espresiff ESP32-D2WD SoC (Xtensa dual-core 32-bit LX6) [11]. As the HVAS gets its energy from the power grid, this energy source is also available for the RDMA. WiFi was the selected RF communication system because the HVAS is used in urban areas with access to WiFi (and alternatively data transmission over 3G/4G). The RDMA (enclosure and the sensor shielding) is fixed with screws to the aluminum housing of the Tisch Environmental HVAS (Fig. 1). In this deployment, the target HVAS was the Tisch Environmental model TE-6070D-BLX-2.5 non-FRM high volume ambient PM2.5 air sampler (for gravimetric method) featuring mass flow controller (MFC) [12]. Tisch Environmental (Cleves, OH) is a company that designs and manufactures high-quality benchmark high volume air samplers (US EPA Federal Reference Method (FRM) and non-FRM).
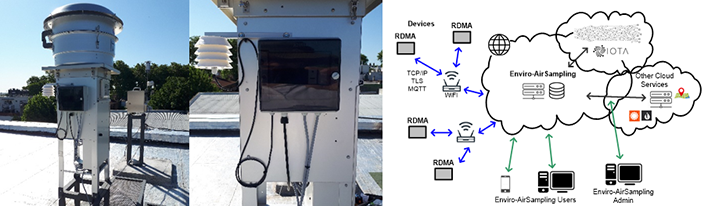
Figure 1: Left: IoT device RDMA attached to Tisch HVAS. Center: Detail of enclosure and environmental sensor shielding. Right: Simplified diagram of the solution architecture showing RDMA devices, Enviro-AirSampling (ENVAS) application, other Cloud services, IOTA network, end-users, and administrator.
Developed Application: ENVAS
The web-access cloud-based application (Fig. 2) enables the access of users to real-time environmental and flow data from each HVAS air sampler in the network, visualization of plots of the variables associated with each HVAS, location of HVAS in a map, and other environmental information (wind speed and direction, precipitations, and climate forecast). ENVAS processes the data received from each IoT device and sends automatic messages (e-mail) to users when needed. Some of the e-mail reported events are: HVAS start/end sampling, volumetric flow out of range, and automatic final report of each sampling experiment. Also, the application records a summary of the key variables of each sampling experiment in JSON format in the IOTA Tangle [13] (Fig. 3). This functionality is useful for traceability, audit, and quality system purposes.
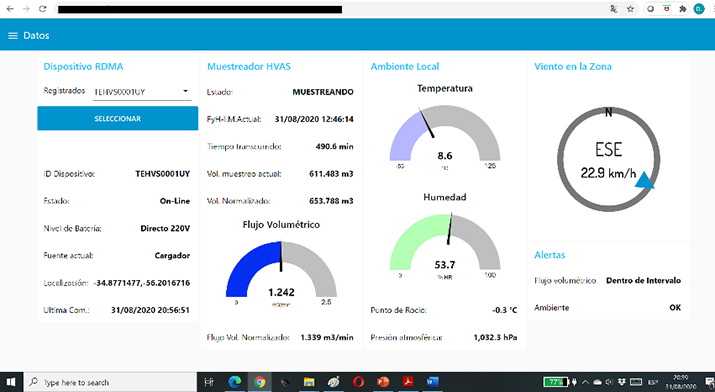
Figure 2: Screenshot of ENVAS main screen showing real-time data for one sampler (some private data is hidden in black).
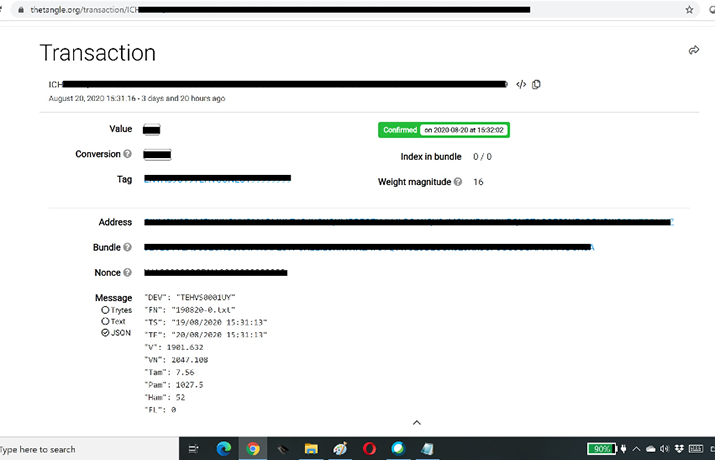
Figure 3: Screenshot of a transaction registered in the IOTA Tangle (accessed using Tangle Explorer) (some private data is hidden in black).
Final Considerations
This solution has been used satisfactorily for almost a year to date. Updates and improvements are being made as more field experience is gained and feedback is received from users during operation.
As a summary, the main benefits obtained with this solution are: a) enables more accurate measurement of total sampled volume and normalized total sampled volume, b) real-time visibility of the sampling process for each sampler in the network, c) brings complementary information useful for the interpretation and analysis of sampling results, d) automatic report generation for each sampling experiment, e) e-mail alarm/event notifications, f) DLT storage capability (useful for QS, traceability or audit purposes).
Future work may involve hardware improvement (for example, to enable the acquisition of new variables), integration of other new IoT devices, and the introduction of predictive algorithms trained using historical data series.
Acknowledgment
To Roberto Suarez-Antola for technical advice in particle transport in the atmosphere and mathematical modeling related issues during the design of the solution.
References
- Health and Environmental Effects of Particulate Matter (PM), United States Environmental Protection Agency (last accessed: September 2020) Available at https://bit.ly/2FmOKMF
- "Health Aspects of Air Pollution with Particulate Matter, Ozone and Nitrogen Dioxide" (2003), World Health Organization.
- Baron P. and Willeke K., “Aerosol measurement: Principles, techniques and applications”, 2nd Edition, Wiley-Interscience, 2005.
- Odino R., Gabrielli A., Piuma L, Suarez-Antola R., “Composición Elemental de las Partículas del Aire de una Zona de Montevideo – Uruguay”, 7th workshop of the International Center for Earth Sciences, 2011.
- Odino R., Reina E., Gabrielli A., Piuma L., “Elemental composition of airborne PM2.5 and PM10 during volcanic ash intrusion in Montevideo, Uruguay”, XRF Newsletter, N°23, September 2012.
- Seinfeld J. and N. Pandis “Atmospheric Chemistry and Physics: From Air Pollution to Climate Change”, 3rd Edition, Wiley, NY, 2016.
- “Guidance for Network Design and Optimum Site Exposure for PM2.5 and PM10” (EPA-454/R-99-022)
- USEPA: 40 CFR Part 58, Appendix D to Part 58 - Network Design Criteria for Ambient Air Quality Monitoring
- USEPA: 40 CFR Appendix J to Part 50 - Reference Method for the Determination of Particulate Matter as PM10 in the Atmosphere
- USEPA: 40 CFR Appendix L to Part 50 - Reference Method for the Determination of Fine Particulate Matter as PM2.5 in the Atmosphere
- ESP32 Series Datasheet, V 3.2 (last accessed: September 2020) Available at https://bit.ly/3m98Niw
- TE-6000 Series Operations Manual Rev1 8-10-2010, Tisch Environmental Inc. (last accessed: September 2020) Available at: https://bit.ly/2Fk788M
- IOTA Homepage (last accessed: September 2020) Available at https://bit.ly/3k4ddoQ
 Diego Suárez Bagnasco Received is BSc. Electronic Eng. in 2002 (Catholic University of Uruguay), PgD Marketing in 2006 (Catholic University of Uruguay), MSc. Biomedical Eng. in 2010 (Favaloro University, Argentina), Ph.D. Biophysical Sciences in 2017 (PEDECIBA, Univ. de la República, Uruguay). IEEE member. An active researcher in the framework of the National Investigators System (SNI) from the National Agency for Investigation and Innovation (ANII) of Uruguay. Currently, he is head at Electronics and Nuclear Instrumentation Laboratory of Laboratorios de Tecnogestión, Ministry of Industry, Energy and Mines (MIEM) of Uruguay, and founder and director at Omnia, Uruguay (contact: dsuarez@ieee.org)
Sign Up for IoT Technical Community Updates
Calendar of Events
IEEE 8th World Forum on Internet of Things (WF-IoT) 2022
26 October-11 November 2022
Call for Papers
IEEE Internet of Things Journal
Special issue on Towards Intelligence for Space-Air-Ground Integrated Internet of Things
Submission Deadline: 1 November 2022
Special issue on Smart Blockchain for IoT Trust, Security and Privacy
Submission Deadline: 15 November 2022
Past Issues
September 2022
July 2022
March 2022
January 2022
November 2021
September 2021
July 2021
May 2021
March 2021
January 2021
November 2020
July 2020
May 2020
March 2020
January 2020
November 2019
September 2019
July 2019
May 2019
March 2019
January 2019
November 2018
September 2018
July 2018
May 2018
March 2018
January 2018
November 2017
September 2017
July 2017
May 2017
March 2017
January 2017
November 2016
September 2016
July 2016
May 2016
March 2016
January 2016
November 2015
September 2015
July 2015
May 2015
March 2015
January 2015
November 2014
September 2014