


CityVerve: Smarter Transport through Data Analytics
With the costs of congestion estimated at £1.5bn per annum, air quality issues and the health consequences of inactivity, the city of Greater Manchester has an objective to create a modal shift towards cycling, from 2% of journeys currently, to 10% of journeys taken by bike by 2025. With 30% of car journeys at under 1km distance, there is a significant potential for change if the right cycling environment can be provided.
Data Collection
The pilot involved 180 cyclists. The user group was selected from more than 400 volunteers to provide a representative demographic sample. The light has a set of sensors and can collect anonymised data about bike journeys, including location and bike motion in three dimensions (that is, not only forward velocity but also tilt motion and vertical motion). See.Sense’s lights shine both in daylight and at night time; and react to moments when a cyclist may be at risk (such as at a junction or intersection) by automatically flashing more strongly and quickly. An associated mobile app also lets cyclists customise their lights and send and receive low-battery, crash and theft alerts.
This data was combined with a range of other city data aggregated on the BT CityVerve Data Hub1.
Data Privacy and Participation
As part of the pilot design, mapping between the participants and the smart lights used was not recorded. Additionally, the data privacy of the participants was maintained by sharing anonymised and aggregated data only. Participants were encouraged to set geo-fenced privacy zones around areas of home or work where they did not wish data to be collected. There has been a high participation rate with over 75% of cyclists actively collecting data, with over 4000 journeys recorded and over 25,000kms logged and over 385 travel issues recorded. The trial results clearly showed representative data from a broad range of cyclists and was not skewed to a particular segment. This is important for planners who want to encourage more women, children and the elderly to cycle.
Data Analytics
Data aggregated across all participants was analysed to provide useful insight for the city with the goal of informing future planning and investment. Presented here are some key examples of this data, specifically road surface quality information and cyclist directionality analysis.
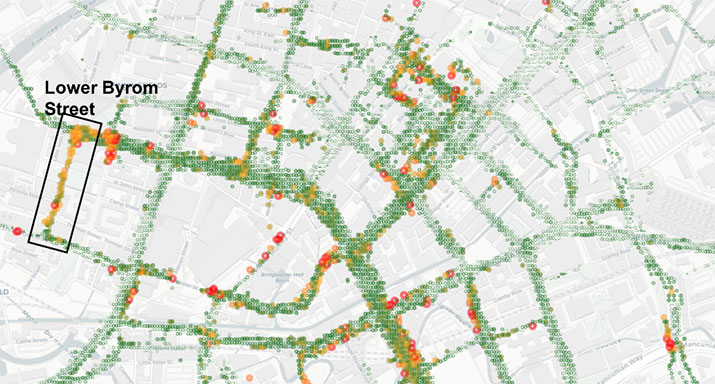
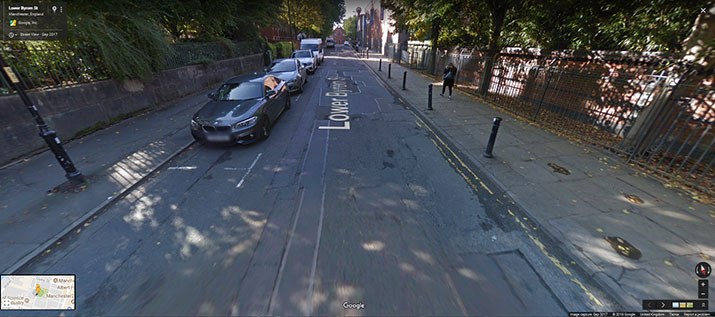
Figure 1 shows road surface quality data automatically generated within Manchester city centre categorised into three distinct classes: green - smooth road which is pleasant to cycle on, orange - a road that has a reasonably rough surface and is less pleasant to cycle on but sufficient for low speed commutes and red - a road considered to be very rough with significant cracks and defects or a cobblestone street. A machine learning classifier is used to calculate road surface quality based on a manually collected training set. This citywide view of the road surface is the first time a crowdsourced dataset has been used in this manner and allows city officials to understand where cyclists experience the roughest surfaces within the city. Action can then be taken to improve the road surface, not just for the comfort of cyclists, but for all road users. Highlighted is a particularly poor stretch of road which is extremely degraded most likely due to recurring maintenance work (see Figure 2).
Another element of the data collection trial is the GPS data which is collected once per second during a cyclist’s journey. This high temporal resolution yields highly accurate information pertaining to the exact route of the cyclist as they navigate through the ever-changing urban environment. Figure 3 illustrates the directionality of the cyclists along two segments of road and can be used to assess the usage of the road by cyclists. Figure 3 is a segment along Oxford Road in Manchester which has undergone major redevelopment in order to create separated bicycle lanes. Yellow lines indicate journeys by cyclists heading north into the city centre and blue represents cyclist heading south away from the city centre. There is a clear delineation between the two directions and it is clear that cyclists can use the lanes in the direction of travel without needing to manoeuvre out of the cycle lane.
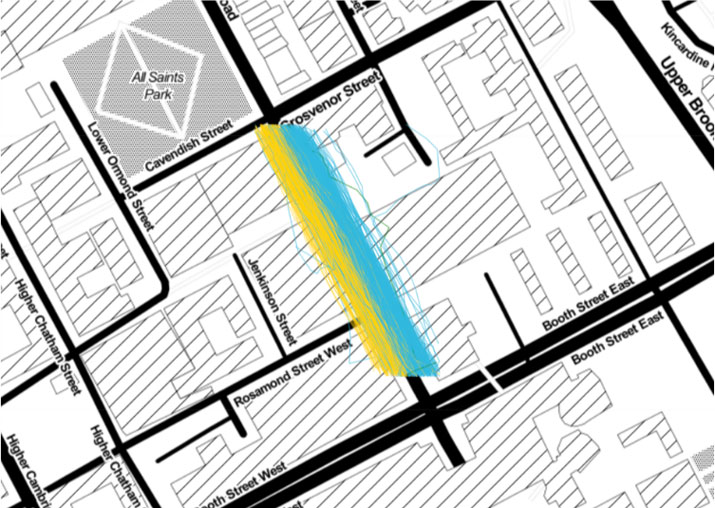
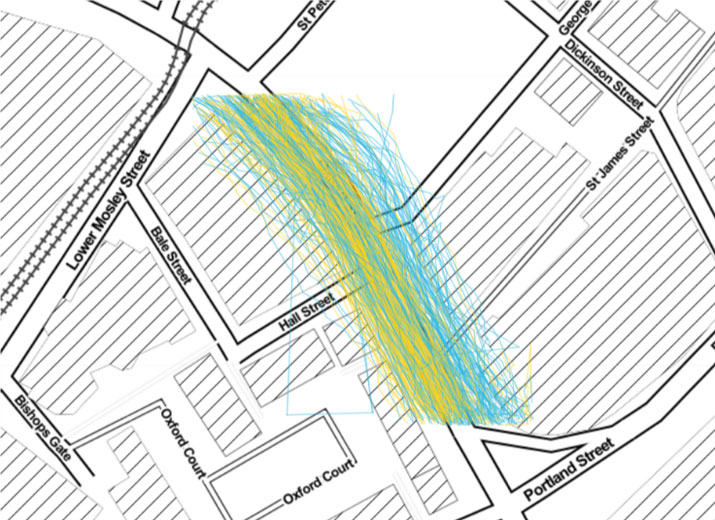
Figure 4 is another segment of the road less than a mile away where there are no separated cycle lanes and cyclists travelling in both directions routinely move from one side of the road to the another while traversing this area. This behaviour not only slows the cyclist down but can impact upon their comfort and safety. An average speed of 19.3km/h for the journeys portrayed in Figure 3 and 12.7km/h for Figure 4 illustrates this point and details how the improved cycle infrastructure enhances a cyclist’s journey.
Near Real Time Insight
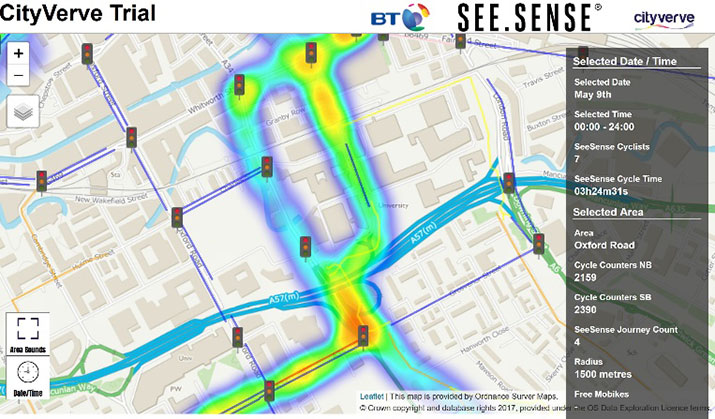
Data collected during the pilot has also been combined with other relevant data sets on the BT CityVerve Data Hub – in particular with information about cycling infrastructure, cycle use, and other traffic and environmental data. This data has been pulled into near real time visualisation and analysis system to demonstrate the potential this kind of analysis can offer city planners (Figure 5).
Conclusions
Insights gathered in this pilot derive from the analysis and visualisation of multiple data sources and they have been crucial for engagement of stakeholders, both in the city and with cyclists. Implementation of actions based on the insights gained will be at a later stage, whereby the findings can be translated into policy and actions to implement change. It will be important for the city to provide a feed-back loop to demonstrate a response to the data and insights contributed by the cycling community in order to maintain the trust and ongoing commitment of the cycling community.
 John Davies is Chief Researcher in BT’s Research & Innovation department, where he leads a team focussed on Internet of Things technologies. He has a strong track record of researching and innovating and his current research interests include the application of Internet of Things and semantic technologies to smart cities, smart transport, business intelligence and information integration. He currently leads BT’s contribution to the Manchester-based CityVerve IoT smart city programme and he co-wrote the Hypercat IoT standard. John has authored over 80 scientific publications and is the inventor of several patents. He is a Fellow of the British Computer Society and a Chartered Engineer. He is a visiting professor at the Open University and holds a PhD in Artificial Intelligence from University of Essex, UK.
 Sandra Stincic-Clarke is Principal Researcher in British Telecommunications’ Future Business Technology, where her work is focussed mainly on the Internet of Things space. Her research interests include IoT, Distributed Systems and Web Services and their industrial application. Sandra provides thought leadership on IoT technologies to BT and has been involved in a number of large collaborative research programmes with national, EU and international funding, most recently managing BT’s contribution to the CityVerve project. She has won several industry awards for her work on IOT and smart cities and has a number of publications in aforementioned areas.
 Irene McAleese is Co-founder and Chief Strategy Officer of cycling technology and data company, See.Sense. Irene leads the company's developing Smart Cities practice and brings years of consulting experience to the role, having led change and workforce transformation initiatives in transport, telecommunications, and resource industries around the world. Irene is passionate about harnessing technology and data to create safer and smarter cities, and is the Winner of the NI Women in Business Award for Best Small Business.
Sign Up for IoT Technical Community Updates
Calendar of Events
IEEE 8th World Forum on Internet of Things (WF-IoT) 2022
26 October-11 November 2022
Call for Papers
IEEE Internet of Things Journal
Special issue on Towards Intelligence for Space-Air-Ground Integrated Internet of Things
Submission Deadline: 1 November 2022
Special issue on Smart Blockchain for IoT Trust, Security and Privacy
Submission Deadline: 15 November 2022
Past Issues
September 2022
July 2022
March 2022
January 2022
November 2021
September 2021
July 2021
May 2021
March 2021
January 2021
November 2020
July 2020
May 2020
March 2020
January 2020
November 2019
September 2019
July 2019
May 2019
March 2019
January 2019
November 2018
September 2018
July 2018
May 2018
March 2018
January 2018
November 2017
September 2017
July 2017
May 2017
March 2017
January 2017
November 2016
September 2016
July 2016
May 2016
March 2016
January 2016
November 2015
September 2015
July 2015
May 2015
March 2015
January 2015
November 2014
September 2014